The Time-on-Task Chart I Can’t Live Without!

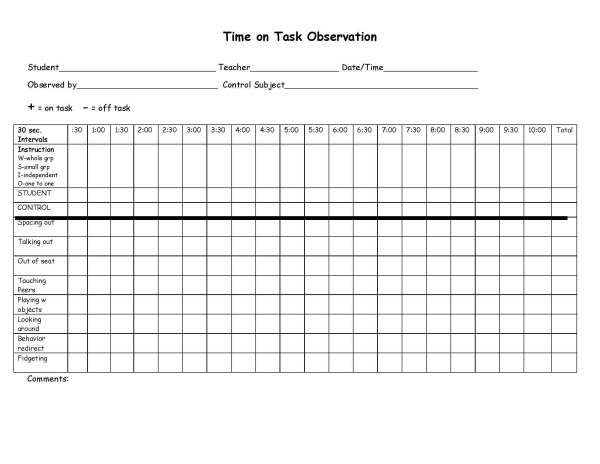
During my 14 years as a special educator, I’ve created and designed various tools, forms, and charts to support students and teachers.  This Time-On-Task Chart, however, is one of my top tools as it has enabled me to gather valuable data about student performance in both general education and special education settings. It measures behavior in 30 second intervals and tracks specific off task behaviors so teachers can easily see patterns in behavior in as little as 10 minutes.

TimeOnTaskObservationChart-1_Page_2Here are some examples of how I’ve use it throughout the years…

Pre-Referral: Data collection and documentation is an important part of the pre-referral and RTI process. This chart has been an effective tool in helping teachers gather baseline data, pinpoint patterns of behavior and determine triggers early in the process.  This information is then used to design behavioral interventions. The chart can be used to measure effectiveness of intervention and compare subsequent ratings to the baseline rating.  Furthermore, since time-on-task data is collected for a control subject as well, important information about the classroom environment, management, or teaching style is gained.  For example, if the control subject’s time-on-task behavior is just as low as the target child’s time-on-task, then perhaps there is an issue with the learning activity or behavioral expectations being provided during that time.

Evaluations: Classroom observations are critical components of multidisciplinary evaluations. I’ve used this chart to collect data and gather important information about how a child functions in the classroom for every single evaluation I’ve completed. I am able to provide concrete data regarding classroom functioning and on-task behavior which helps to provide a holistic picture of the child.

IEP Progress Updates: For students who have time-on-task or classroom functioning goals, I’ve used this chart to regularly progress monitor and update IEP goals.  It allows me to provide a concrete percentage of time-on-task, along with information about specific behaviors, learning tasks, grouping arrangements which impact student behavior.  I’ve also charted the data and shared with students and parents.  Students love to see when they make improvements!  If a student is not making progress, it is a great opportunity to discuss challenges and make necessary changes with them.  This helps to increase ownership and responsibility.

Behavior Intervention Plan: Data collected from the time-on-task chart provides key information about antecedents, behaviors, and consequences in authentic classroom settings. Since data collection is quick and easy, frequent data points can be collected throughout the day or week to measure effectiveness of behavior intervention plans.

Communication with Parents: In addition to sharing information about time-on-task behavior on formal IEP updates, I’ve also used this data during conferences and informal check-ins with parents.  Parents have also reported that this information was helpful to share with outside counselors and doctors to assist with ADHD diagnosis and monitor effectiveness of treatment and/or medication.

Directions
This easy-to-use documentation tool can be used by special educators, general educators, paraprofessionals and related service personnel.

1. Choose a target student to observe and a control subject (same age,same sex peer) to which to compare the student.
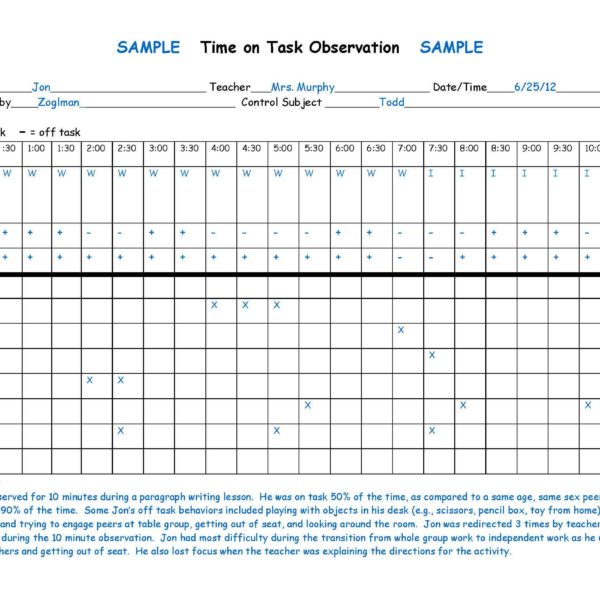
2. Indicate type of instruction: W-whole group, S-small group, I-independent, O-one to one for each interval of the observation.
3. Use a watch or stop watch to track the time. At every 30 second interval, either mark + for on task behavior or for off task behavior.
4. If the student is off task, indicate the specific off task behavior in the chart.
5. Total up data and calculate percent to determine total time the student was on task.
6. Use comments below to note additional observations and anecdotal data.

TimeOnTaskObservationChart-1_Page_1Download our Time-on-Task chart today!  Available on TPT and here. 

Don’t just take my word for it though…Here’s what others have said about this chart as well:


“Perfect! Just what I was looking for. Great observation form.” ~Jill Y.

“This is an excellent tool! I’ve used it for three students today! Very helpful…thanks!” ~Bill J.

“Exactly what I was looking. Thank you for saving me the time :).” Julie W.

“Really handy form to have to use for observations.” ~Renee R.

“I had my principal use this during one of my observations! It also gave me concrete data to take to my RTI meeting.” ~Marecela W.


Thanks for stopping by!

Jennifer_blog_signature-SMALL

It’s Tom Tabling Turtle!

Howdy, I’m Tom Tabling Turtle and I make tables-
These are columns and rows with numbers and labels.
Always organize your information, is what I say,
So you can discover patterns and relationships in a logical way.

Tom Tabling Turtle is our newest animal in our Problem-Solving Pond: A Common Core Math Strategy Unit. The Problem-Solving Pond was created to help teachers overcome Common Core math challenges and employ problem-solving strategies with confidence and fidelity. Tom’s unit is perfect for general education, special education, RTI and math intervention. Read more about Tom’s strategy below or download the complete unit here.

WHAT is the table strategy? Students make a table complete with labeled columns and rows. The table strategy helps students write information in an organized format, allowing them to easily identify number patterns and relationships.

WHY is the table strategy important?  When students make a table, they organize information in a logical way and critically examine data patterns to create a solution.
Tom Tabling Example_WEB

HOW do I teach the table strategy?  When you introduce and practice the strategy, give students a pre-made table. Todd’s turtle shell provides scaffolding with space for labels and organized columns and rows for neat data entry. As students become proficient with the table strategy, teach them to make their own table so they can use this strategy independently without the need for a pre-made table.

WHEN should I use the table strategy? This is an ideal strategy for developing mathematicians who have a solid number sense foundation. It is most effective for repeated addition or multiplication story problems.

Helpful hints:

Use a pre-made table.  Young students often lack fine motor skills needed to construct a table, but are perfectly capable of using this strategy. Provide a pre-made table, such as Tom’s turtle shell or a simple table made in Microsoft Word so students can easily input data.

Turtle Chart

Provide visual support. After teaching students how to construct a table, be sure to write and post directions (along with visual support) in a prominent place during problem-solving time.  Students would also benefit from an anchor chart like this one as well.
How to make a mathematical table_WEB


Jessica-Blog-Signature

Introducing Daphne Drawing Dragonfly

Hi, I’m Daphne the Drawing Dragonfly.
Draw a mathematical picture to give my strategy a try.
Read the problem and draw what’s going on;
Then write a number sentence for what you have drawn. 

Daphne Drawing Dragonfly is our newest animal in our Problem-Solving Pond: A Common Core Math Strategy Unit. The Problem-Solving Pond was created to help teachers overcome Common Core math challenges and employ problem-solving strategies with confidence and fidelity. Daphne’s unit is perfect for general education, special education, RTI and math intervention. Read more about Daphne’s strategy below or download the complete unit here.

WHAT is drawing? Students make a visual representation of the story problem such as a picture, bar model, tens frame or array.

Jake bar model

WHY is drawing important? When students use the drawing strategy, they are making a concrete representation, strengthening understanding of the mathematical concepts.  Effective math classrooms include frequent use of pictorial representations to help students process and visualize mathematical concepts learned.

HOW do I teach drawing?Teach students to create neat, organized drawings with labels and numbers. Students will need to be taught the bar model and arrays, but it is best to let students create the pictorial representation that they see and works for them.

WHEN should I use drawing? This strategy is ideal for presenting a new mathematical operation.  Most teachers use this strategy with K-2 mathematicians, but this is also beneficial for older students as it works especially well with money, fractions, ratios and percentages. Drawing is a great way to double-check solutions because the visual representation increases understanding of the problem.

Helpful hints:

  • Create drawing guidelines. As a class, decide important components to include in a mathematical drawing. Possible components include:
    • Simple drawings
    • Appropriate spacing
    • Neat labels (words or numbers)
    • Easy to read

Guidelines for math pictures

  • Encourage students to use a variety of pictorial representations.  Often students will get in a “strategy rut”, relying on one strategy for many different kinds of story problems. While drawing is an effective strategy for most problems, the type of pictorial representation used depends on the type of story problem.

Types of Pictorial Representations2_Page_1


Sign up for
blog updates

© 2020 – Astute Hoot. All rights reserved.